

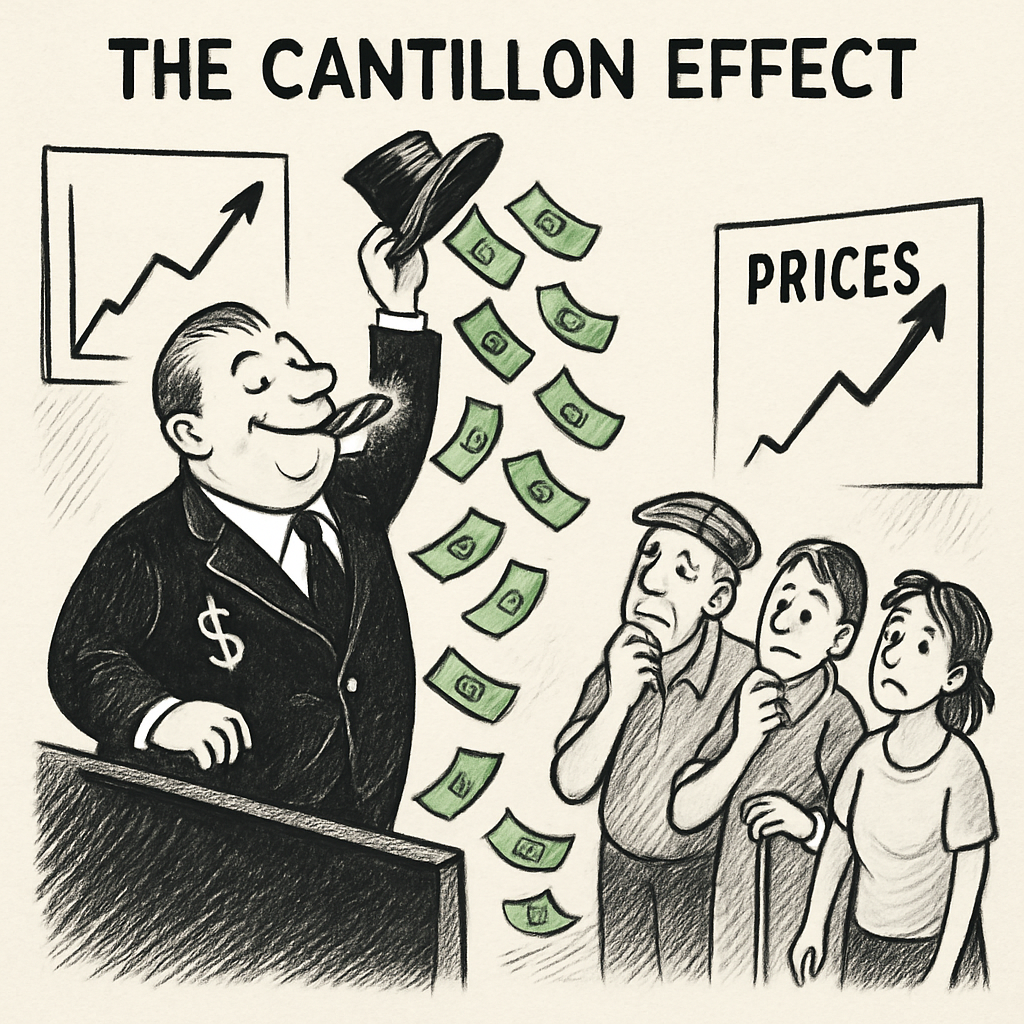
The Cantillon effect is a surreptitious method of stealing money from the people disconnected from the source of funds. Chat GPT has a more succinct way of explaining it than I do:
The Cantillon Effect refers to the uneven and often hidden distributional effects that occur when new money is introduced into an economy. Named after the 18th-century economist Richard Cantillon, it highlights how those who receive new money first benefit the most, while those who receive it later, or not at all, are disadvantaged.
🔍 How It Works:
When new money is created—such as through central bank stimulus, quantitative easing, or credit expansion—it doesn’t get distributed evenly across the population. Instead, it flows through specific channels, such as:
- Banks
- Government spending
- Financial markets
- Large corporations
These entities are the “first recipients” of the new money and can spend it before prices rise in the broader economy.
📈 Consequences:
- Asset Price Inflation:
- The first users of the new money often buy assets (stocks, real estate), causing prices to rise before wages or consumer prices catch up.
- The first users of the new money often buy assets (stocks, real estate), causing prices to rise before wages or consumer prices catch up.
- Rising Inequality:
- Wealthy individuals and corporations (closer to the source of new money) see their wealth increase.
- The poor and middle class (further from the source) suffer from rising prices without a proportional rise in income.
- Wealthy individuals and corporations (closer to the source of new money) see their wealth increase.
- Distorted Economic Signals:
- Artificially low interest rates and excess liquidity lead to misallocation of resources, speculative bubbles, and economic cycles.
- Artificially low interest rates and excess liquidity lead to misallocation of resources, speculative bubbles, and economic cycles.
- Inflation Lag:
- By the time the new money trickles down to ordinary consumers, the prices of goods and services have often already risen—eroding purchasing power.
- By the time the new money trickles down to ordinary consumers, the prices of goods and services have often already risen—eroding purchasing power.
📊 Real-World Example:
- After the 2008 financial crisis and during the COVID-19 pandemic, central banks injected trillions into the economy.
- Financial markets and housing prices soared.
- But wages and consumer prices lagged behind—hurting renters, savers, and wage earners.
🧠 Summary:
The Cantillon Effect shows that money is not neutral. Where and how new money enters the system has significant effects on who gains and who loses.
It’s a powerful critique of modern central banking and a core concept in Austrian economics and critiques of fiat money systems.
We are subject to this effect as we speak, to greater and greater effect as more currency is fed into the system.
Artificially low interest rates exacerbate the problem and weaken the Dollar. The current administration continually calls for lower interest rates. This cripples savers and investors.
I remember sitting with my father working out how much he would have to invest at close to 10% interest in order to retire. It was a fraction of what is required at, (if you are lucky) 4%.
The affordability of buying a house is almost an impossibility for the younger generations as salaries and wages by far lag real inflation.
This makes more and more people reliant on government grants = Total control of the population.
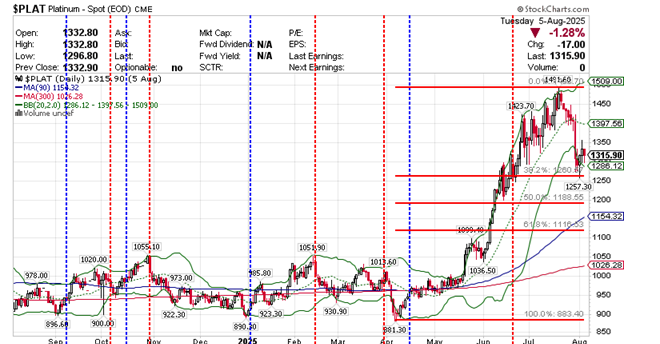
PLATINUM
SELL: (20 June 2025). PLAT touched the Fibonacci retracement. Let’s see if it bounces off it. No buy signal yet.
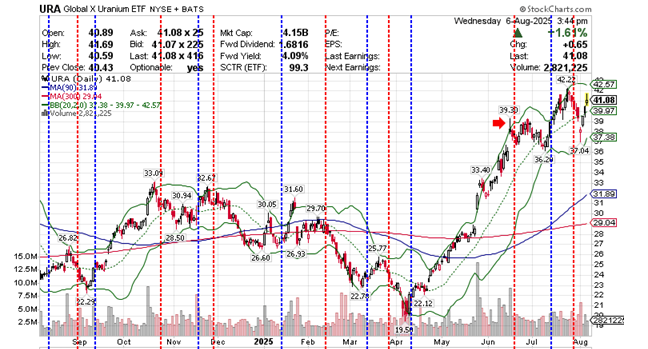
URANIUM
SELL: (30 July 2025) URA. Turning but no buy signal yet. One could buy based on the spike low.
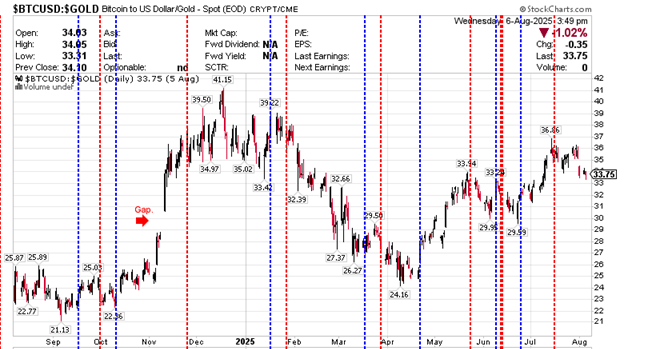
BITCOIN AND GOLD
BUY gold versus Bitcoin (18 July 2025). Gold outperforms bitcoin.
ETHUSD: SELL: 30 July 2025.
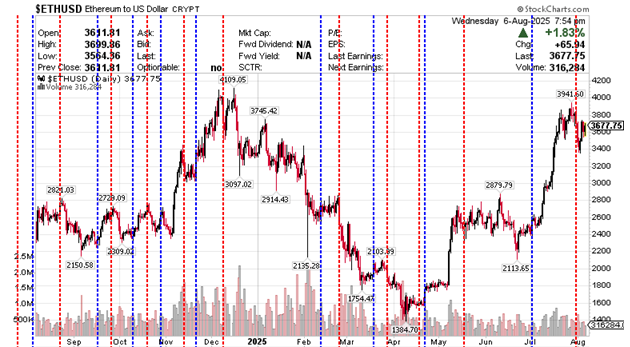
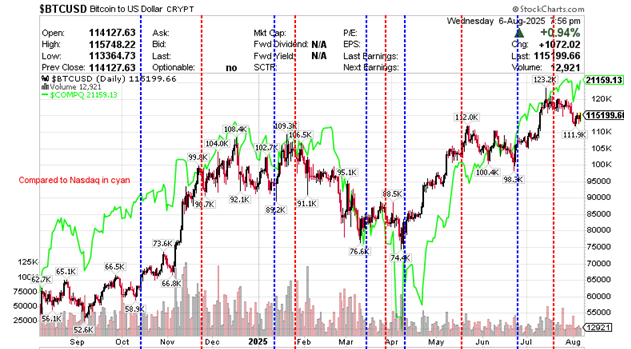
BTCUSD: SELL: 19 JULY 2025. NASDAQ (Cyan). Turning but no buy signal yet.
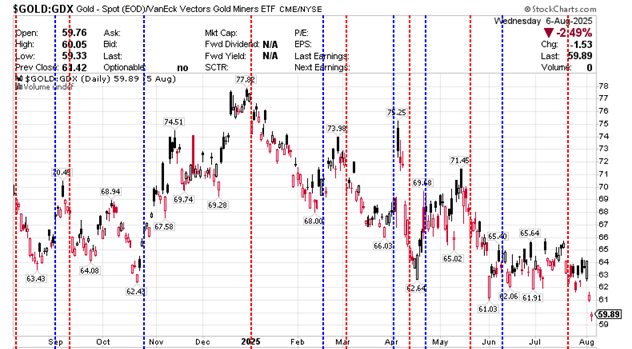
GOLD AND SILVER STOCKS
Gold stocks outperforming gold (23 July 2025).
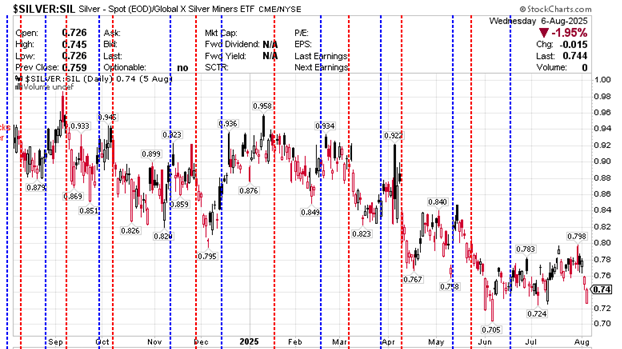
Silver outperforms silver stocks (17 June 2025).
GOLD AND SILVER
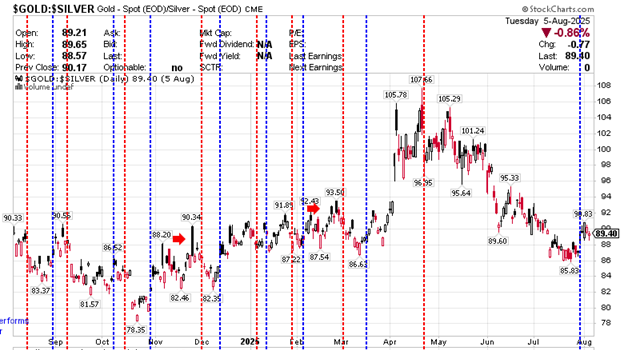
Silver to Gold Ratio
Gold outperforming Silver. (Signal given 30 July 2025) When we think that silver is coming out of the ground at about 8:1 and the Gold:Silver ratio is 86.36, something is way out of kilter.Silver is an astounding buy at this time or gold is in for an extremely heavy correction. The ratio appears to be turning but no confirming signals yet.
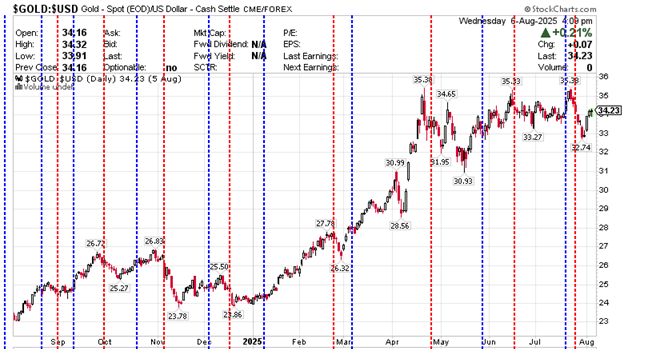
GOLD TO USD
USD outperforms Gold, (25 July 2025). Appears to be turning, awaiting confirmatory signals.
A LOOK AT THE GOLD AND SILVER CHARTS
| Today | Last Week | |
|---|---|---|
| Gold price | $3,382.00 | $3,308.00. |
| Silver price | $38.34 | $36.65 |
| Gold:Silver ratio | 88.30:1 | 90.23:1 |
| Gold Miners bullish percent index | 96.43 | 86.71 |
| Dollar Index | 98.24 | 99.86 |
| Dow:Gold Ratio (BahaUS 44,260.00 Gold price, $3,382.00) | 13.08 | 13.47 |
| Current USA inflation rate (Dept. of Statistics) | 2.4% | 2.7% |
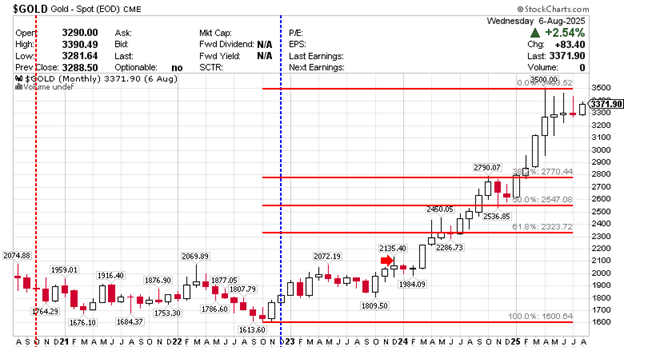
Gold’s low of the week was $3,345.00 and the high was $3,397.00, now trading at around $3,382.00.
- Gold Monthly: is a hold. We bought in at $1,800.00 in October 2023. Funds flows into the metal are substantial. Looking overbought, but it can hold that situation for a while. No sell signal yet. (Chart below).
- Gold Weekly: (SELL 12 May 2025) The sell indicators were very early, but I see no signs of recovery at this point. We have mixed signals. The indicators are looking more negative. The weekly price is moving sideways with a small upwards bias.
- Gold Daily: (BUY 08 August 2025). A reluctant buy, based on the indicators. Emotion must be thrown out of the window. Just follow the signals.
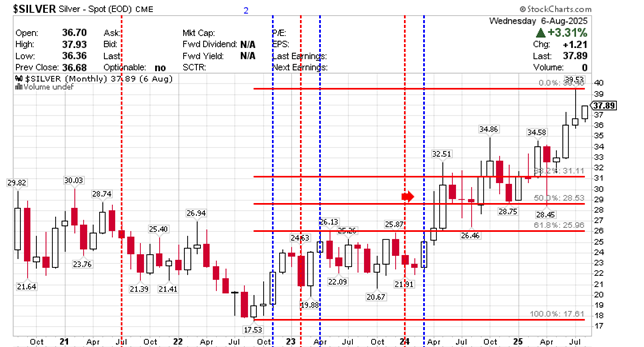
The low for Silver this week was $36.67 and the high $38.50 trading around $38.20 at present.
- Silver Monthly: Hold. (Buy: $24.00 March 2024). Looking overbought but positive flows of cash into the metal. ( Chart below).
- Silver Weekly: (SELL 28 July 2025). Spike high the previous week. Indicators turning up.
- Silver Daily: SELL (25 July 2025).
Our partner has stock of both gold, silver and Goldbacks in our vaults available in Panama. Please contact us for more information.


A video by Mike Adams on the Goldbacks.
Well worth a look!
On the Stockcharts.com charts, the blue vertical lines are our proprietary system buy signals and the red vertical lines are system sell signals – for information purposes only.
An interview with Josh, owner of Scottsdale Mint:
Please contact us to arrange the purchase and storage of your gold and silver requirements in a safe, insured location outside of your jurisdiction.
If you are interested in an overview of Fort Kobbe, you may want to have a look at this video: Mike Brown, Director, Fort Kobbe, International Vaults, A DotCom Magazine Exclusive Interview
This is my interpretation of the market and is not to be taken as financial advice. Before making any buy or sell decisions I recommend that you consult with your professional financial advisor.


RECENT COMMENTS