


We have lost the plot completely. People of the world are being driven down the war path by zealots determined to make the military, industrial, banking, political cabal rich at the expense of the people.
The notion that our elected officials are looking out for the people they represent is long gone.
Military contracts are notoriously full of loopholes, side payments, and corruption. Imagine with these vast amounts of currency being ‘spent’ how many and how much never sees ‘investment’ in a weapon.
Who tracks where, by whom and on what each dollar goes, once it is allocated for disbursement?
The stories we are fed as the current reason for war are usually an out and out lie. Of course the narrative is built by governments as to why we should be at war.
We, without access to real information, as the news is so tightly controlled, believe the narrative and mostly support the government line.
At what point do the people stop and take stock of the deterioration of their living standards, their lack of control over the behavior of their politicians, the profligacy of the central banks, the ever tightening control over their personal lives, control of how much, where and on what they can spend their hard earned and taxed earnings?
I think that when it happens woe betide people in the sights of the slighted populations. Slowly the lies are being uncovered and the harm done to the people is being revealed.
I trust that sufficiently capable people will be able to stop this juggernaut in time.
“It is well enough that people of the nation do not understand our banking and monetary system, for if they did, I believe there would be a revolution before tomorrow morning.”
― Henry Ford

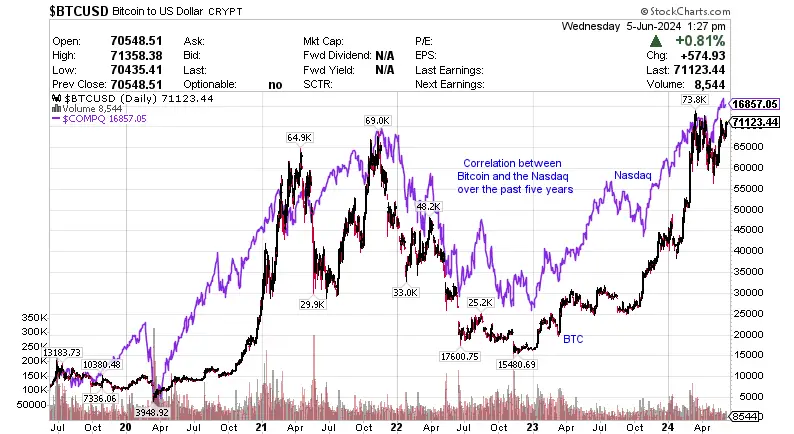
BITCOIN AND GOLD
Here is a fun chart of the trajectory of Bitcoin and the Nasdaq plotted against one another. The correlation is quite remarkable. (Nasdaq in purple).
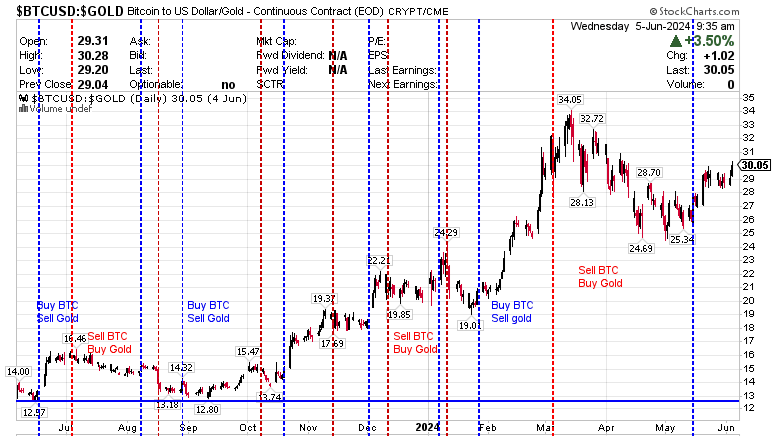
BTC:GLD below shows bitcoin outperforming Gold. Our buy signal on BTC last week against gold appears to be continuing.
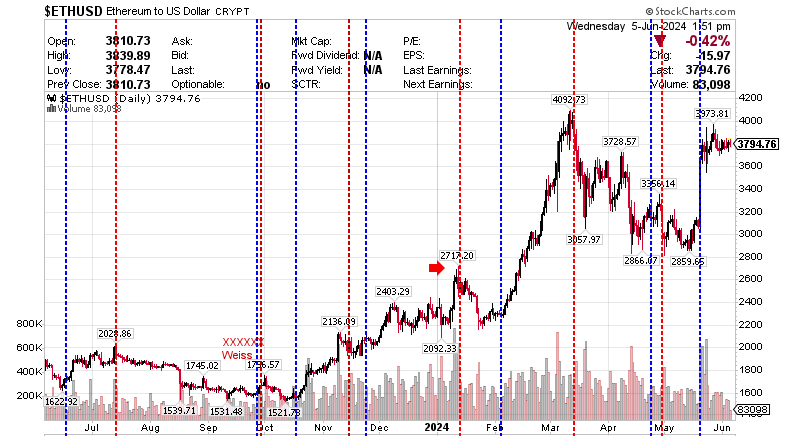
ETHUSD is in hold mode. It is moving sideways and the indicators are slowly failing but no sell signal yet. I am waiting one more day to see if ETH is still a hold.
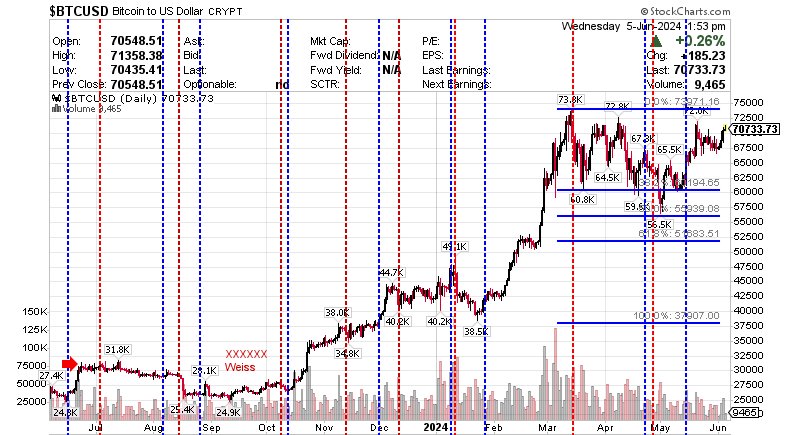
BTCUSD is still a hold. It appears to be making a reverse head and shoulders pattern which if it completes portends higher prices. Indicators look positive.
GOLD AND SILVER STOCKS
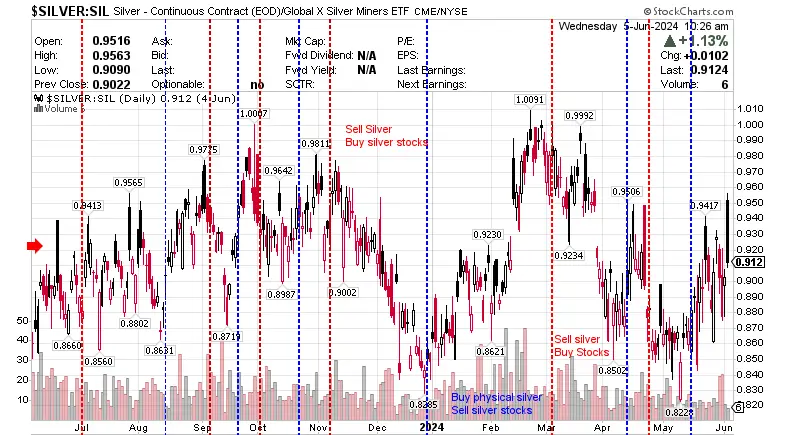
Yesterday physical gold gave a signal that it will now outperform the stocks.

Physical silver continues to outperform silver stocks. Demand for physical silver is growing continually and is being reflected in the physical to stocks comparison.
GOLD AND SILVER
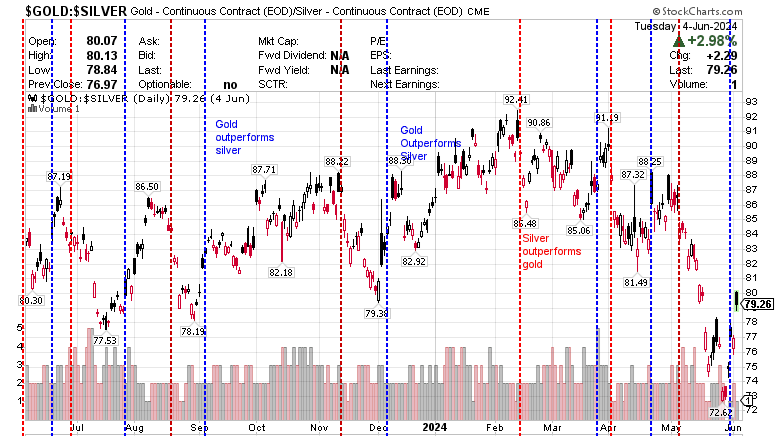
Gold is outperforming silver. Silver has had a nice run for the past two weeks and needs a rest and consolidation before moving up again.
Physical supply of silver is insufficient and it is a matter of time before realistic prices emerge. My conservative guess would be around $150.00 to $200.00 based on current Gold prices.
GOLD TO USD
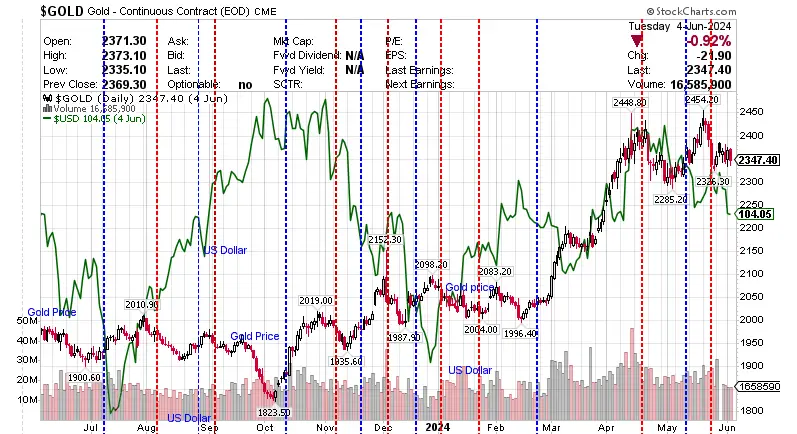
Gold v USD The chart below shows that the inverse correlation between the dollar and gold has broken since April, a correlation between them generally exists. (Gold = red/black candlesticks. Green = Dollar).
A LOOK AT THE GOLD AND SILVER CHARTS
| Today | Last Week | |
|---|---|---|
| Gold price | $2,358.00 | $2,344.00 |
| Silver price | $30.17 | $31.29 |
| Gold:Silver ratio | 78.09:1 | 74.80:1 |
| Gold Miners bullish percent index | 85.71 | 89.29 |
| Dollar Index | 104.22 | 104.68 |
| Dow:Gold Ratio (BahaUS 38778.00 Gold price, $2,358.00) | 16.44 | 16.26 |
| Current USA inflation rate (Dept. of Statistics) | 3.4% | 3.5% |
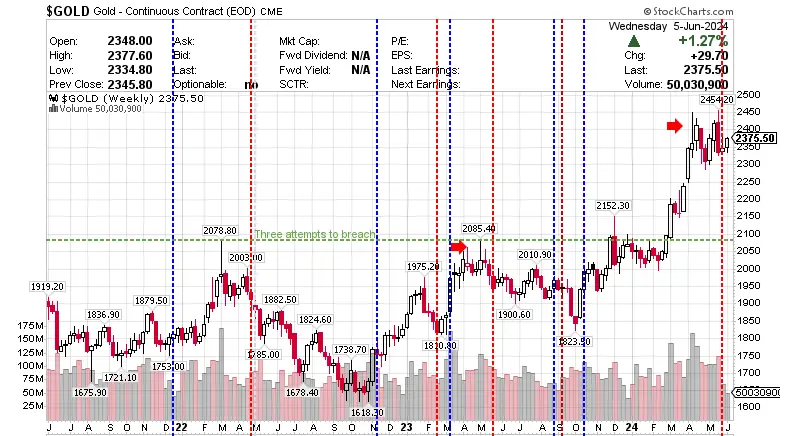
Gold’s low of the week was $2,314.00 and the high was $2,374.00, now trading at around $2,354.00.
- The monthly chart for Gold is a hold. We bought in at $1,800.00 and have held it to date. It looks overbought but the indicators are mainly positive.
- The weekly chart has given a sell. Looking overbought with mixed signals. (Chart below).
- The daily chart, we are out but price is consolidating.
The low for Silver this week was $29.37 and the high $30.89, trading around $30.18 at present.
- Silver on the monthly chart indicates a hold. The signals look strong for now.
- The silver weekly chart is a hold. It looks overbought and seems to be running out of steam. (Chart below).
- The silver daily chart indicates a sell even though the OBV is increasing. This is most unusual so bear careful watching, but makes sense in view of the buying pressure from India. It should push the price up but ???

Our partner has stock of both Gold, Silver and Goldbacks in our vaults available in Panama. Please contact us for more information.

A video by Mike Adams on the Goldbacks.
Well worth a look!

On the Stockcharts.com charts, the blue vertical lines are our proprietary system buy signals and the red vertical lines are
system sell signals – for information purposes only
Please contact us to arrange the purchase and storage of your gold and silver requirements in a safe, insured location outside of your jurisdiction.
If you are interested in an overview of Fort Kobbe, you may want to have a look at this video: Mike Brown, Director, Fort Kobbe, International Vaults, A DotCom Magazine Exclusive Interview
This is my interpretation of the market and is not to be taken as financial advice. Before making any buy or sell decisions I recommend that you consult with your professional financial advisor.


RECENT COMMENTS