


In what was reported as a veiled threat, Saudi Arabia threatened to sell European debt holdings if the G7 seized the three hundred billion dollars worth of Russian assets confiscated from the Russians.
Interestingly the threat was made to Europe (G7), it appears not to America.
The Saudi’s denied making the threat in a statement sent to Bloomberg. They did however admit to having outlined such a consequence as a possibility.
My opinion is that the freezing of the assets makes sense in war. There is no declared war with Russia, either by Europe or the US, so in my opinion the seizure of the assets is illegitimate and the theft of the proceeds of the funds is totally immoral.
What this does is inflame the situation, which I believe to be the intended purpose. The entire Russia Ukraine situation appears to be critical as it stands right now.
Should the Saudi’s carry out their ‘consequence’, it has the potential to affect international bond markets and as a result stock markets.
The misuse of the reserve currency and financial markets as a tool for punishment has long-term effects that jeopardize the entire worldwide financial system. BRIC’s is certainly a method of getting out of the dollar SWIFT system.
I can’t help feeling that we are being hoodwinked by the new BRIC’s system as the SWIFT and BRIC’s systems both are working with the BIS (Bank of International Settlements).


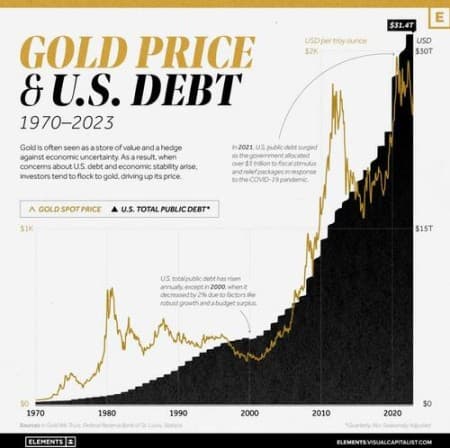
What interests me about the above two charts, is the correlation between the Federal debt, the Standard and Poor 500 Index, and the gold price all moving in tandem.
The inflation rate may well be slowing, but inflation is increasing relentlessly even at a slower rate. The FED is contemplating a rate cut into the pre-election period, politically, for the incumbent regime, an essential move to keep them in power. For the economy and inflation, the next administration will be left with the fallout.
BITCOIN AND GOLD
BTC:GLD below shows gold outperforming Bitcoin. Some indicators are turning up, but no switch yet. Looking close to a reversal.

ETHUSD we are out of ETH and it looks like it is beginning to recover. I see a tweezer bottom and some of the indicators are turning up. By the end of this week or early next week I expect a buy signal.

BTCUSD we are out. Right now the indicators are turning positive, but no buy signal yet.

GOLD AND SILVER STOCKS
Gold stocks continue to outperform gold.

Silver stocks now outperform physical silver.

GOLD AND SILVER

This is a question we continually ask. If the ratio goes to 1:1 or 1:0.5 where will the prices settle?
Silver to Gold Ratio
The indicator has switched to silver outperforming gold.

GOLD TO USD
Gold is outperforming the USD. This is an early indication.
Silver and gold prices jumped this morning as the US dollar took a substantial hit falling from 1.0498 early in the morning to 1.0410 a short while ago. This may seem like a small amount but in major currencies, it is 0.838% which is significant.

A LOOK AT THE GOLD AND SILVER CHARTS
| TODAY | LAST WEEK | |
|---|---|---|
| Gold Price | $2,407.00 | $2,359.00 |
| Silver Price | $31.60 | $30.40 |
| Gold:Silver ratio | 76.73:1 | 77.57:1 |
| Gold Miners bullish percent index | 85.71 | 78.57 |
| Dollar Index | 104.19 | 105.21 |
| Dow:Gold Ratio (BahaUS 39,705.00 Gold price, $2,407.00) | 16.49 | 16.68 |
| Current USA inflation rate (Dept. of Statistics) | 3.4% | 3.3% |
Gold’s low of the week was $2,349.00 and the high was $2,413.00, now trading at around $2,407.00.
- The monthly chart for Gold is a hold. We bought in at $1,800.00 in October ‘23 and have held it to date. It looks overbought but the indicators are mainly positive. (Chart below).
- The weekly chart remains out. There are encouraging signs but no definitive buy yet.
- The daily chart has a buy signal on gold.

The low for Silver this week was $30.42 and the high $31.75, trading around $31.32 at present.
- Silver on the monthly chart indicates a hold.The signals look positive.
- The silver weekly chart is a hold. It is holding above its old trading zone which is positive. We bought it for $24.00.
- The silver daily chart indicates a hold.

Our partner has stock of both gold, silver and Goldbacks in our vaults available in Panama. Please contact us for more information.

A video by Mike Adams on the Goldbacks.
Well worth a look. Watch here

On the Stockcharts.com charts, the blue vertical lines are our proprietary system buy signals and the red vertical lines are
system sell signals – for information purposes only
Please contact us to arrange the purchase and storage of your gold and silver requirements in a safe, insured location outside of your jurisdiction.
If you are interested in an overview of Fort Kobbe, you may want to have a look at this video: Mike Brown, Director, Fort Kobbe, International Vaults, A DotCom Magazine Exclusive Interview
This is my interpretation of the market and is not to be taken as financial advice. Before making any buy or sell decisions I recommend that you consult with your professional financial advisor.


RECENT COMMENTS